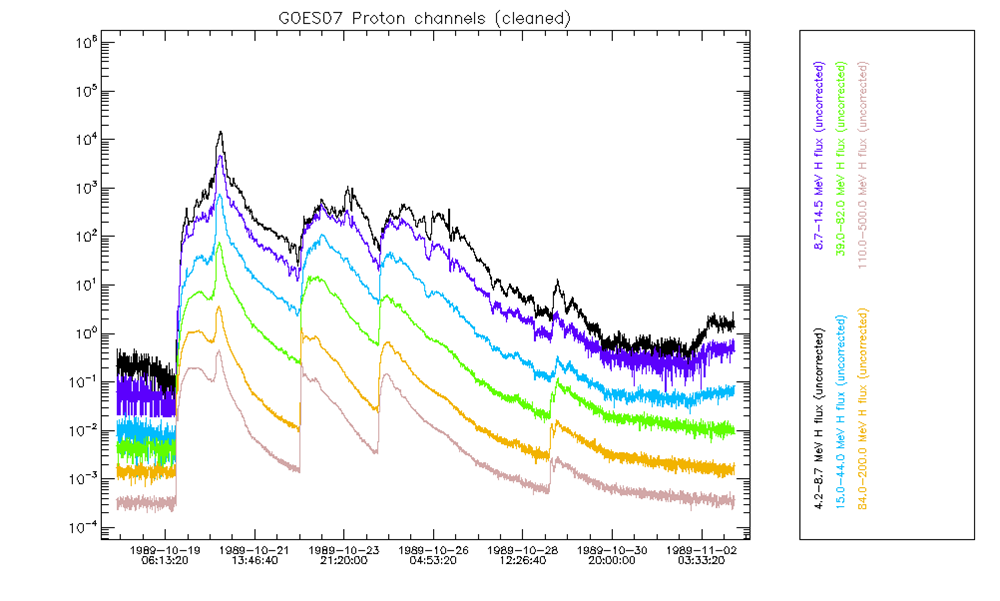
GOES07/SEM data for the Oct 89 event
The SEPEM reference proton dataset is intended to be used for analysing proton induced radation effects. The energy range covered by the dataset is 5–200 MeV, in ten logarithmically spaced channels, which can be interpreted as a virtual instrument dataset (the energy channels are listed below).
For IMP8, data from the GME and CPME instruments have been analysed for suitability in the reference dataset construction. It turned out that the CPME instrument suffered from severe saturation (and possibly other) effects, and that in addition there were numerous gaps in the dataset. Therefore, it was decided not to use these data. The GME data also show saturation effects and data gaps, but to a less severe extent than the CPME data. Nevertheless, especially during the second half of the mission, a number of very large SEP events are insufficiently covered by the GME data. A detailed analysis of the data caveats was compiled for the CPME and GME datasets.
The GOES/SEM proton data do not suffer from saturation, and only have relatively small data gaps, which can be filled with interpolation or usage of the secondary GOES spacecraft data. A detailed description of the GOES/SEM proton datasets and caveats was also compiled.
In order to make maximum use of the strong points of the respective datasets, the following procedure was used to combine the data:
| Original dataset | Original time span | Time span of the selected data | Comments |
|---|---|---|---|
| IMP8/GME | 01-11-1973–26-10-2001 | 01-11-1973–26-10-2001 | Primary dataset prior to 01-01-1984. Data were also used to cross-calibrate the GOES/SEM data. Channel 92.5–107.0 MeV was not used. |
| GOES05/SEM | 01-01-1984–24-03-1987 | 01-01-1984–05-03-1987 | |
| GOES07/SEM | 06-03-1987–12-08-1996 | 06-03-1987–28-02-1995 | |
| GOES08/SEM-2 | 01-03-1995–31-05-2003 | 01-03-1995–31-05-2003 | |
| GOES11/SEM-2 | 01-07-2000–28-02-2011 | 21-06-2003–28-02-2011 | Due to large data gaps, data prior to 21-06-2003 are only used for cross-calibration. |
| GOES12/SEM-2 | 01-01-2003–28-02-2010 | 01-06-2003–20-06-2003 | Used to bridge the three week gap between GOES08 and GOES11. Channels P6 and P7 are missing, data values for this period set to 0.0026 and 0.0012, respectively (surrounding background level, verified with GOES10 that these channels remain at background level during this period). |
| GOES13/EPS | 01-05-2010–30-06-2013 | 01-03-2011–31-03-2013 | The cross-calibration factors for GOES11 were applied as there is insufficient overlap. |
As the energy range of the SEPEM proton reference dataset is limited to 5–200 MeV, not all energy channels of the GME, SEM and EPS instruments are required. The tables below list the channels which were retained for the construction of the reference dataset.
|
|
|
|
|
||||||||||||||||||||||||||||||||||||||||||||||||||||||||||||||||||||||||||||||||||||||||||||||||||||||||||||||||||||
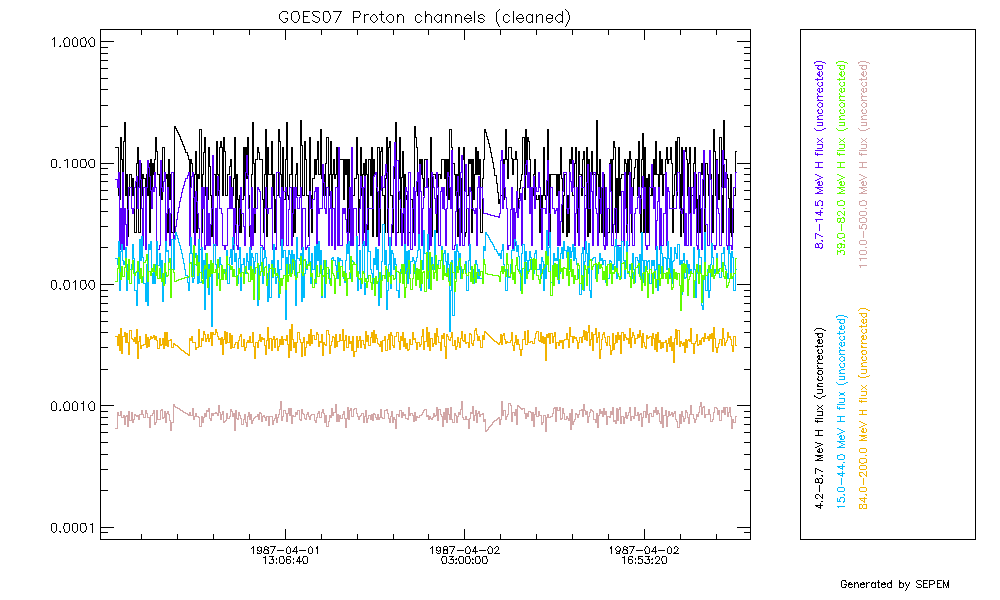
As an illustration, the figure below shows the GOES07/SEM proton data during the Oct 89 event.
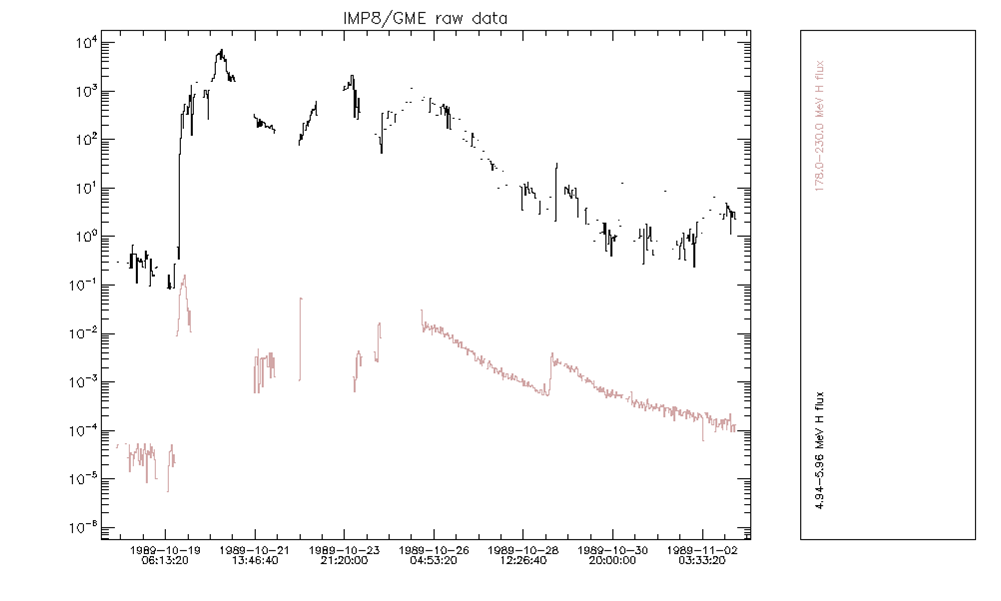
The next figure shows the same event as seen in two channels of the GME data. The following defects are immediately obvious:
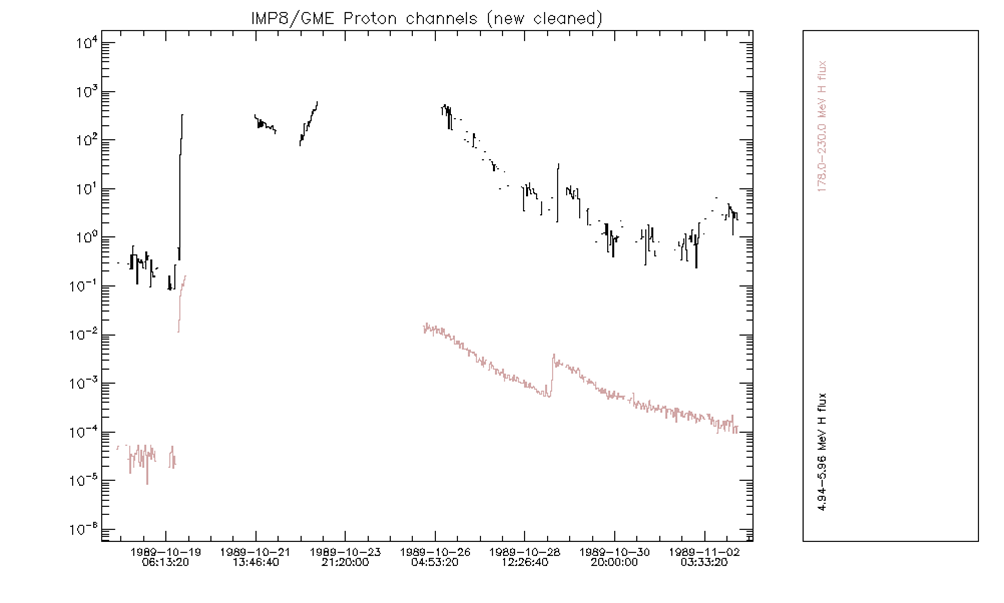
Upon closer examination, and comparison with the GOES/SEM fluxes, it turns out that the complete rise phase and the flux peak suffer from contamination. After removing the affected records, what remains is shown in the figure below. It is clear that most of the event is missed using the GME data. The same applies to several more large events, and in general, even during smaller events, the peak phase is often missed if saturated points are removed.
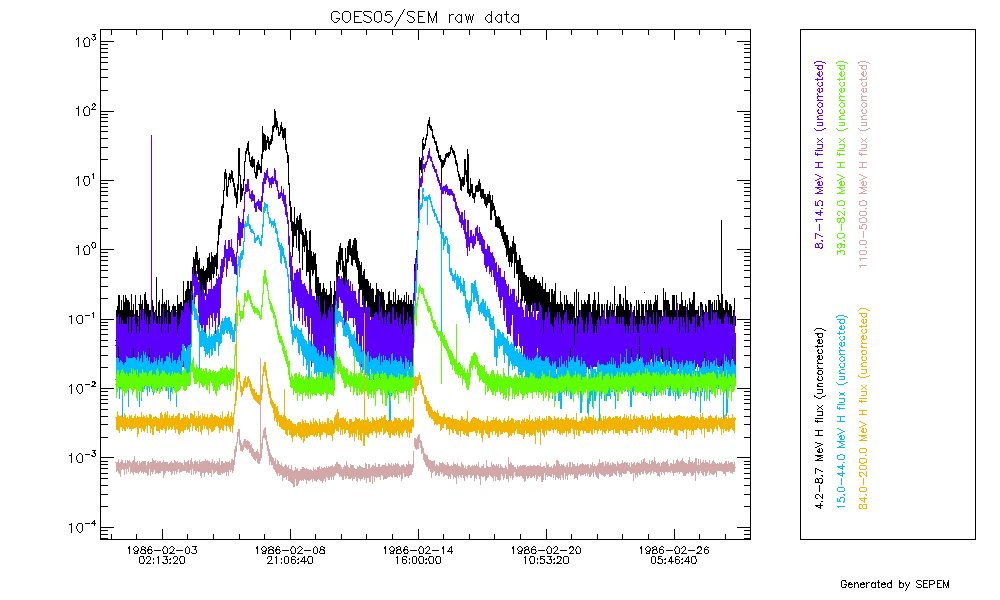
The situation for the SEM data is better, in the sense that saturation does not occur. However, the SEM data suffer from the appearance of data spikes, as illustrated below for a month of data of GOES05/SEM.
It is obvious that these spikes need to be removed before further data processing can take place. During the SEPEM project, a number of algorithms were tested to try to automatically recognize and remove data spikes. One automated method is implemented on the SEPEM server: median filtering. Although this method is able to recognize many of the spikes and to remove them, it has the tendency of lowering the event peak flux (by the nature of the method), and it does not recognize all data spikes.
Other methods were tried, but in the end it was decided to remove the spikes by hand. To this effect, an application was developed for the SEPEM server where suspicious data points can be marked and removed. This application was used to manually remove all data spikes in the GOES and IMP data that were used to construct the proton reference dataset. The figure below shows the same GOES05/SEM data sample as above after removing the spikes.

After removing the data spikes, the resulting gaps, and any other gaps in the original data, need to be filled in order to arrive at a continuous dataset. The figure below shows a two day sample of GOES07/SEM data where data gaps are clearly visible.

Using the data cleaning tool, these gaps were filled using a linear interpolation. The result is shown in the figure below.
All data gaps in the GOES/SEM data were filled in the same way,
resulting in a new set of GOES/SEM data where all spikes have been
removed, and all gaps filled. The data gaps in the IMP8/GME were not
filled, as they are too large. The cleaned datasets are available on
the system as tables standard_0001 to
standard_0007.
In the SEPEM database, a separate table was created to store all data removal and gap filling actions, i.e. every data point, for the individual channels, that was removed or replaced during gap filling, has been logged.
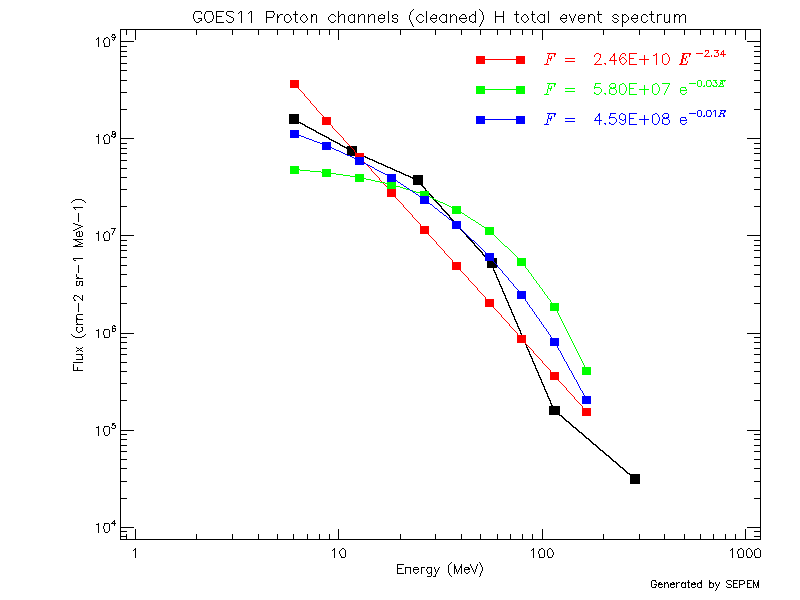
Firstly, analytical fits to the energy spectra for each data record were computed. Using the analytical fits, new datasets were produced for the energy channels of the proton reference dataset. Three fit functions were tested: power law in energy, exponential in energy, and exponential in rigidity. After comparing the fitted data to the original data, it was concluded that using analytical fits over the total energy range of the proton reference dataset did not produce acceptable results, for the following reasons:
For reference, the same plot is shown using the proton reference dataset (which was obtained by applying cross-calibration to the IMP8/GME data, as described in the next section).
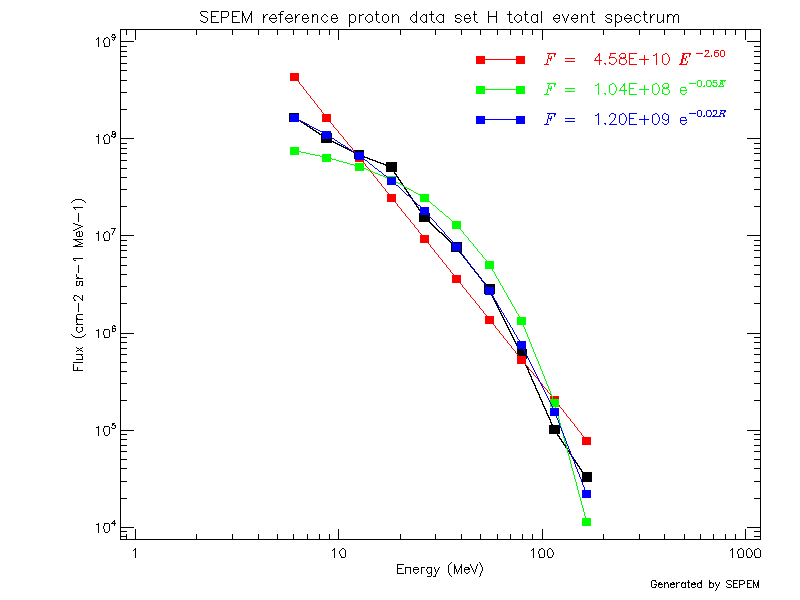
Using the cross-calibrated data, the background signal in the high energy channel has been substantially reduced, resulting in much better spectrum fits. Similar behaviour is shown over the entire dataset; the plots shown here were generated using the event spectra tool on the SEPEM server.
As applying analytical fit functions over the whole spectrum energy range results in unreliable spectra, it was decided to apply power law fits over each separate energy channel: for each energy in the proton reference dataset, the flux values at the boundaries of the original data channel enclosing the reference energy were used to interpolate the original flux to the reference energy. This procedure was repeated for all reference energy channels, for all data records in the GME and SEM datasets used to construct the proton reference dataset. This procedure was performed using the energy re-binning tool on the SEPEM server, for each of the five datasets used. The fitted data were stored in separate tables, for cross-calibration as described below.
Before merging these datasets into a single contiguous set, one more step needs to be taken. The SEM(-2) instruments on the various GOES spacecraft are monitor instruments and are not rigorously calibrated, and exhibit significant differences in response, making a simple concatenation of the re-binned datasets impossible. The procedure adopted to use a common baseline for the SEM(-2) instruments on the four GOES spacecraft used for the proton reference dataset, consist of using the GME data as a reference. The GME instrument is a science quality instrument, which has been properly calibrated.
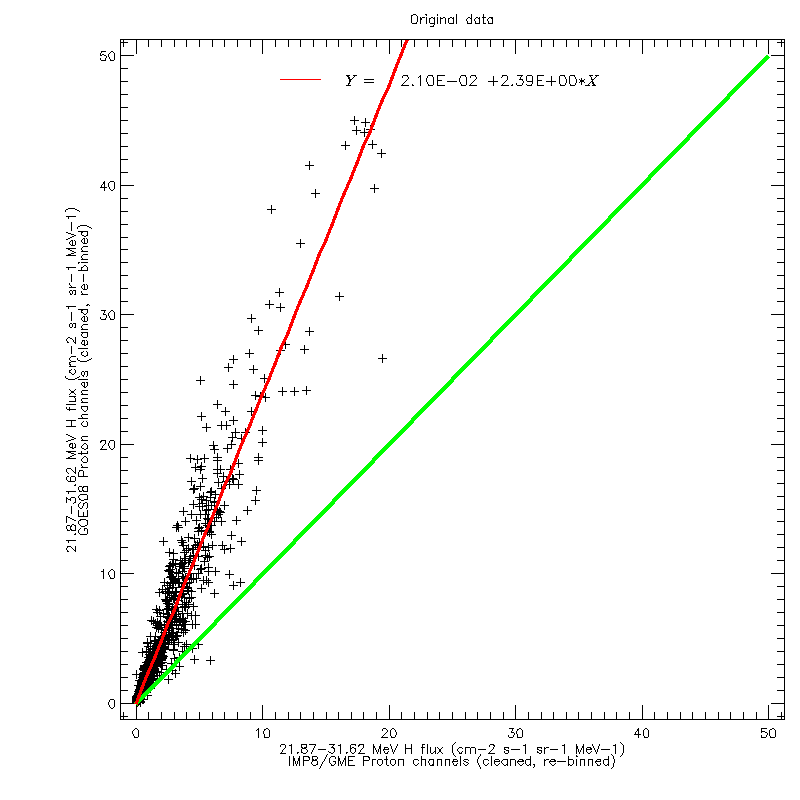
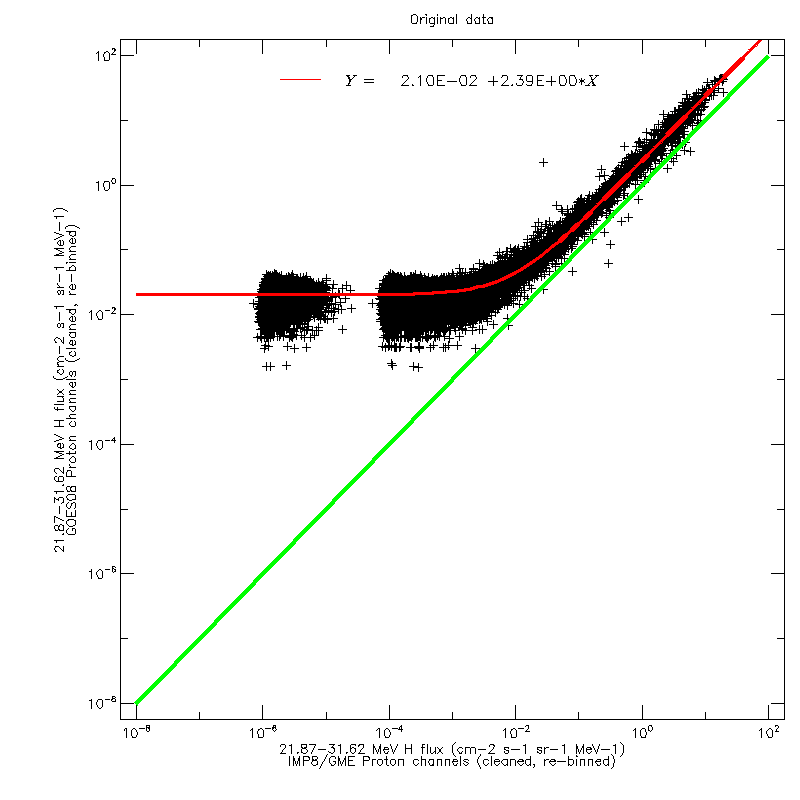
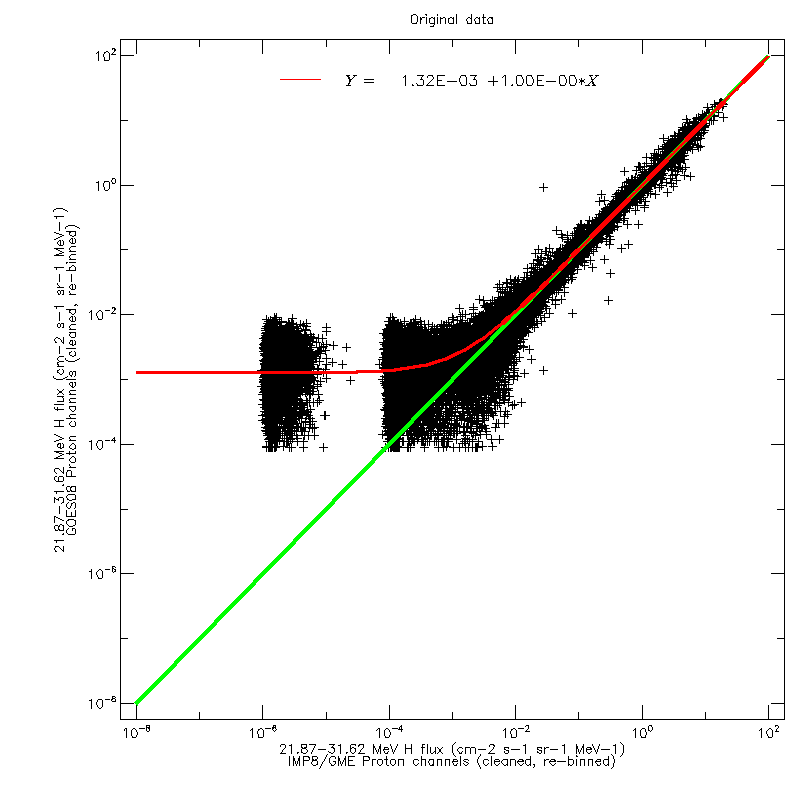
For each of the four GOES datasets, and for each of the ten reference energy channels, linear regression fits were calculated to scatter plots of the GOES and GME data (after re-binning in energy). The figures below show the scatter plot for the 21.87–31.62 MeV channel, using GOES08 data, on a linear and logarithmic scale, respectively. The regression fit was calculated using the original values, not the logarithms.
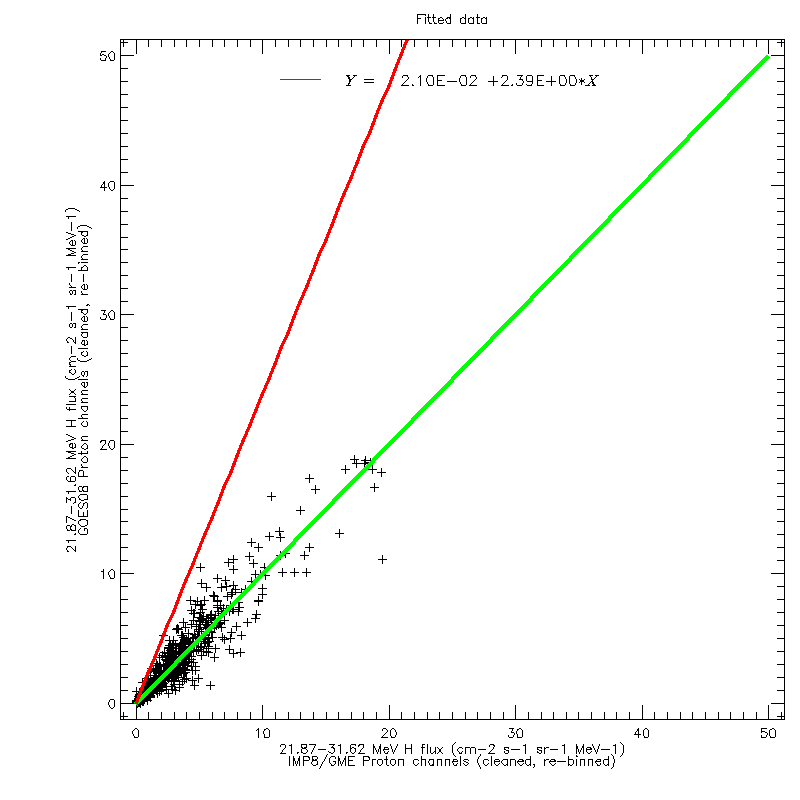
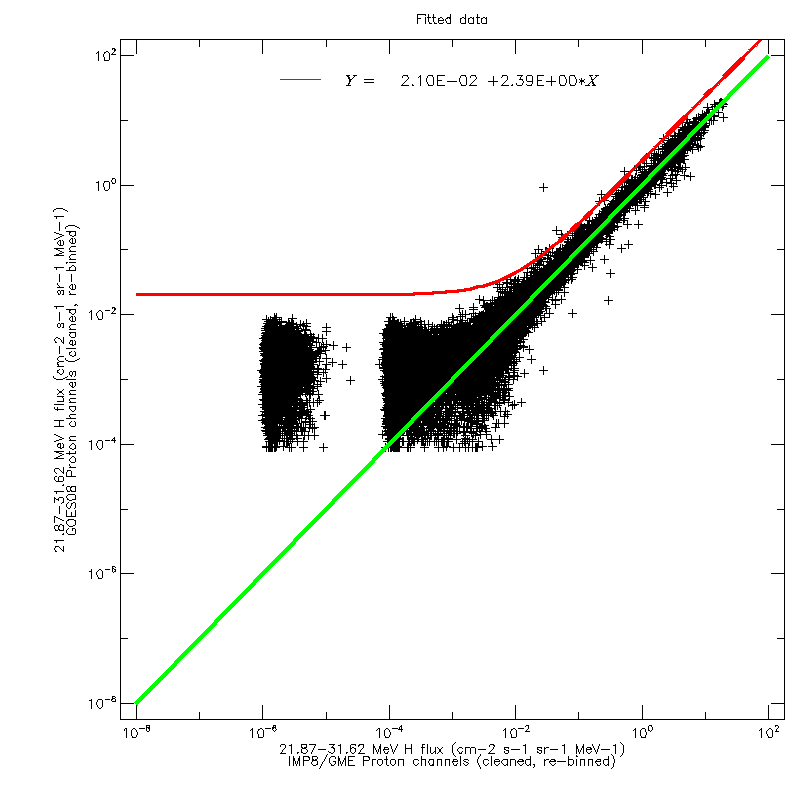
For each data channel, the inverse regression fit was then applied to the GOES data, to align them with the GME data. The figures below show the data of the two above figures after applying the inverse fit. After applying the cross-calibration, the data are now scattered around the line of equality.
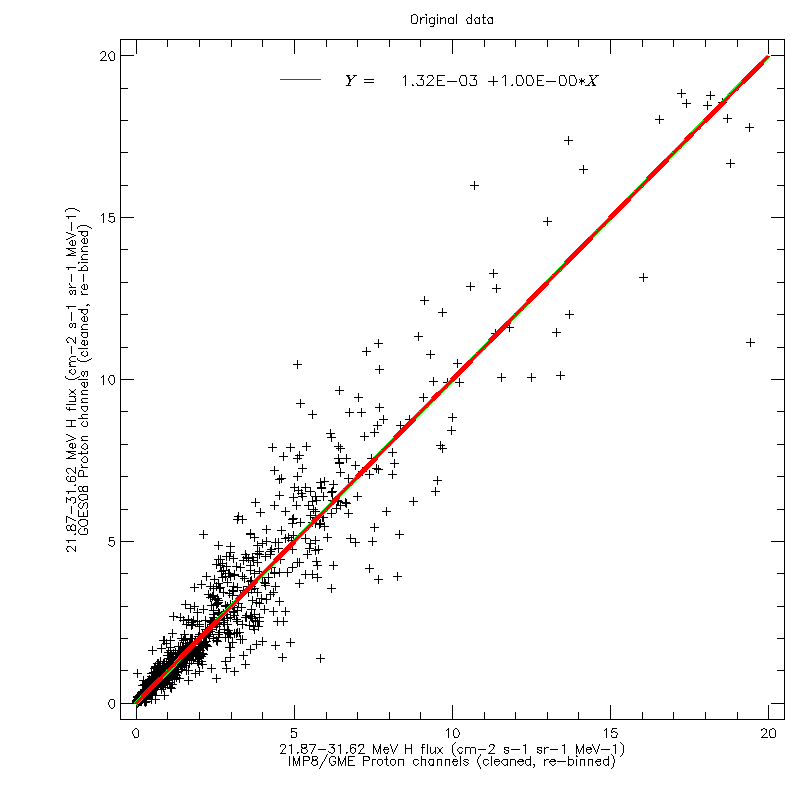
As a further test, the regression fits were applied to the cross-calibrated data, shown in the figures below. The regression line thus obtained is identical to the line of equality.
Similar plots were produced for all proton reference energy channels, for the four GOES datasets used for the proton reference dataset. The plots are available as a zip archive. All regression fits were performed with the Cross-calibration tool on the SEPEM server.
standard_0008, which contains the final proton reference
dataset.
Last modified on: 14 December 2018.